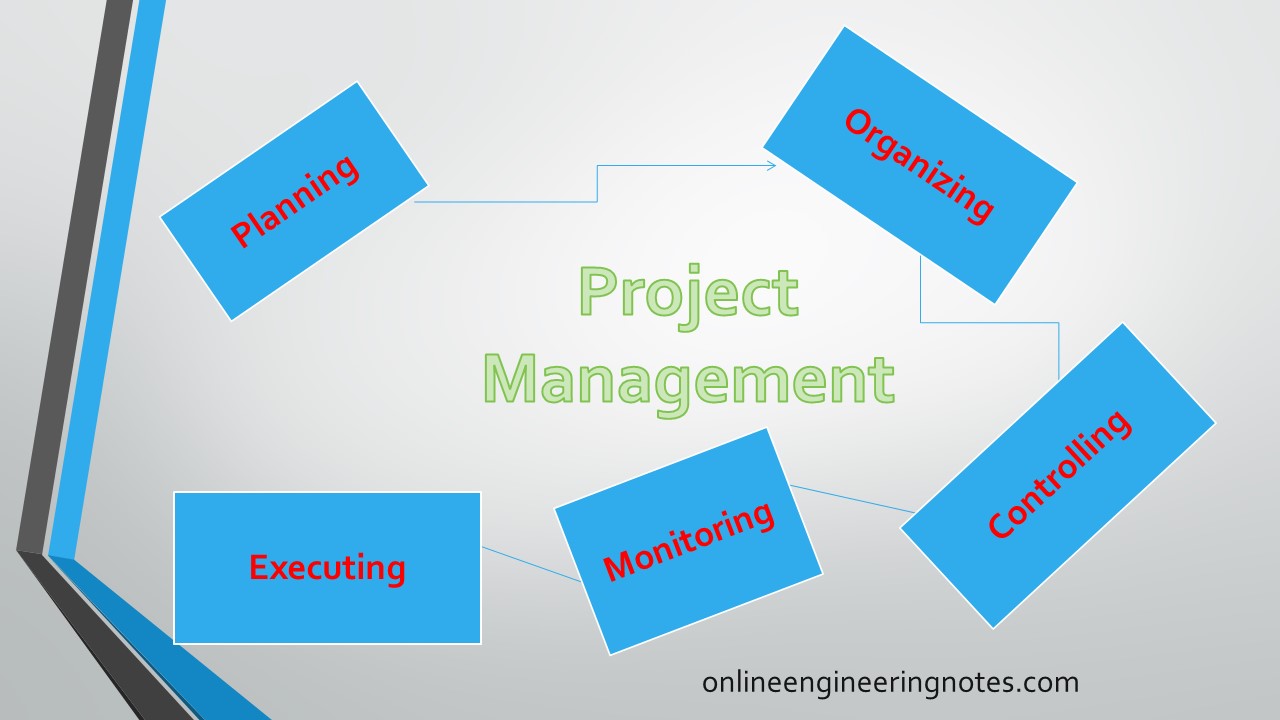
Project Management
Project management is the application of knowledge and skills along with experiences and associated with various processes and methods to achieve specific project objectives within agreed parameters and according to project acceptance. It is constrained to a finite time scale and within budget.
Project management also involves identifying and managing risks, careful resources management, smart budgeting, and clear communications among different stakeholders and team networks.
The purpose is to plan and manage the project to the successful completion of its listed goals and deliverables.
What is marketing?
Marketing is a complete set of processes that involves researching, promoting, selling, and distributing products or services. i.e., marketing is not other than getting potential clients or customers interested in the products or services.
The project life cycle
The project life cycle is a time frame. It includes the steps required for managers to successfully manage a project from start to the finish.
It includes 5 phases
- Initiating
- Planning
- Executing
- Monitoring/controlling
- closing
Setting project objectives & goals
Setting up project objectives means the clear, precise, and measurable steps needed for achieving the set goals. Objectives are very specific that typically have a time-bound schedule for completion.
Whereas goals are broad vision and direction and almost align with the company mission, vision, and culture.
For example:
Goals: Being a top-grossing company over the next 5 years
Objectives: Increasing sales by 5% p.a.
Goals are always SMART:
- Specific
- Measurable
- Attainable
- Relevant
- Timely
Network model: CPM & PERT
CPM (Morgan R. Walker,1957)
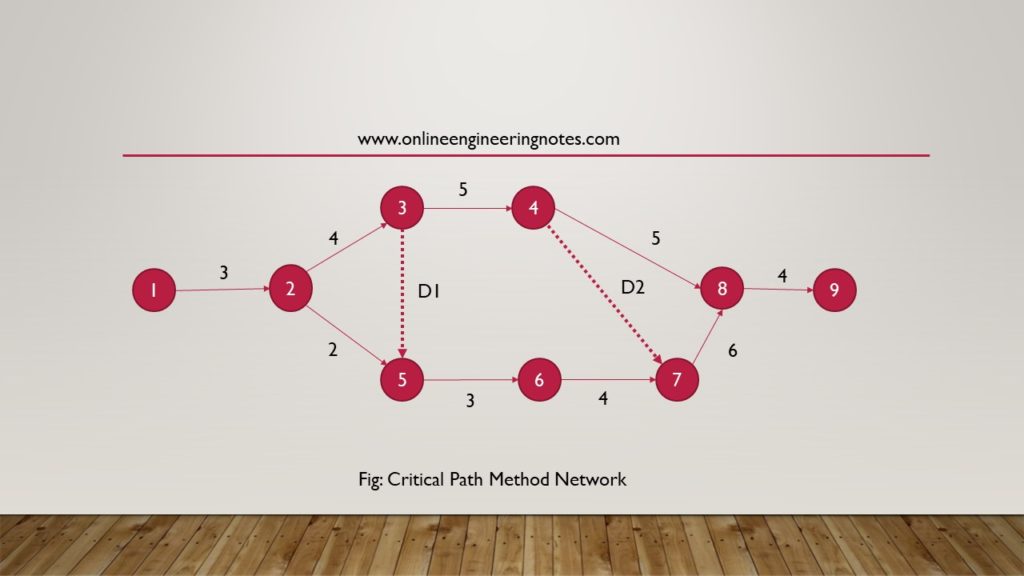
In the Critical Path Method, networks, the whole project consists of a number of clearly recognizable jobs called activities.
The Critical Path Method (CPM) is a network technique to deal with large and complex projects.
Activities are usually the operations, which take time to carry out and on which resources are expended. It is used for a repetitive type of project, which take a fairly accurate estimate of time for completion of each activity can be made. This technique is useful to determine how best to reduce the time required to perform production, maintenance, and construction. It helps to minimize the direct and indirect costs of a project.
The main characteristics of CPM are:-
- CPM is activity-oriented.
- CPM times are related to cost.
Terms associated with CPM:
- Critical Path
It is the longest path on a network that does not allow any delay. If any delay on the critical path brings a delay in the project. The activities lying on the critical path are known as critical activities.
- Total project time/critical time
This is the total duration of time of all the activities falling on the critical path and gives the total project duration of the network.
- Activity and Events
Activity consumes time and resources while the event is the instant of time. Activity is denoted by an arrow and event is denoted by a circle, triangle, etc.
The beginning and end of activities are the events.
- Head & Tail Event
Head event represents the end of a project. i.e. it lies at the end of an arrow and is the last event of the project. therefore, there is only one head event.
The tail event represents the beginning of a project.it lies at the start of an arrow and is the first event of the project. Therefore, there is only one tail event.
- Dual role event
All the intermediate events other than head and tail events become dual role events. Intermediate events will be at the head of the arrow or at the tail of the arrow hence these are called dual role events.
- Non-critical activity
Activities that do not lie on the critical path are non-critical activities. The delay on non-critical activity can be permitted which does not delay the overall project.
- Dummy activities
An activity on a network that neither consumes resources nor time is called a dummy activity. Also called redundant activities. It helps to maintain the logic of the network and is denoted by the dotted line.
Calculation of CPM Network
Rules: Forward & Backward Pass
While calculating the Earliest Expected Time/Earliest Finish time for the occurrence of an event, we started from the initial event and ended with the last event. This is called a forward pass.
EFT=TEi+tij
Where TEi =Earliest Start Time
For calculating the Latest allowable Time/Latest Start Time for the occurrence of an event, we started from the end event and arrived at the initial event. This is called backward pass.
LST=TLj-tij
Where TjL=Latest Finish Time
Types of float
Float means a certain range within which an activity’s start time or its finish time may fluctuate without affecting the completion time of the project.
- Total float
It is the difference between the Latest start time the and Earliest start time or the Latest finish time and the Earliest finish time.
- Free float
It is the difference between the Earliest finish time and the Earliest start time for its successor activity. therefore, it affects proceeding activities.
Numerically, FF=TF-slack of head events
- Independent float
It is the excess time available when proceeding activities finish as soon as possible and succeeding activities start as early as possible. It affects only particular activities.
Numerically, IF= FF-slack of a tail event
- Interfering float
The difference between total float and free float is called Interfering float.
Numerically, If = TF-FF = slack of head event
Q. A project schedule has the following characteristics
| Activity | 1-2 | 2-3 | 2-5 | 3-4 | 3-5 | 4-7 | 4-8 | 5-6 | 6-7 | 7-8 | 8-9 |
| Time (day) | 3 | 4 | 2 | 5 | 0 | 0 | 5 | 3 | 4 | 6 | 4 |
- Construct Network Diagram
- Compute the earliest event time and latest event time
- Determine the critical path and total project duration
- Compute the total and free float for each activity
Solution:
1.

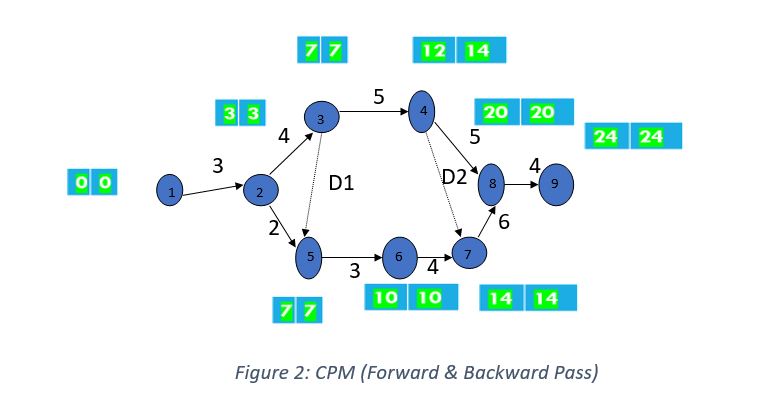
2. Earliest Event Time
Forward Pass
EFT=TFi + tij
= EST + d
EFT = max (TiF + tij)
Backward Pass
LST = TjL – tij
= LFT – d
LST = min (TjL – ti)

3.
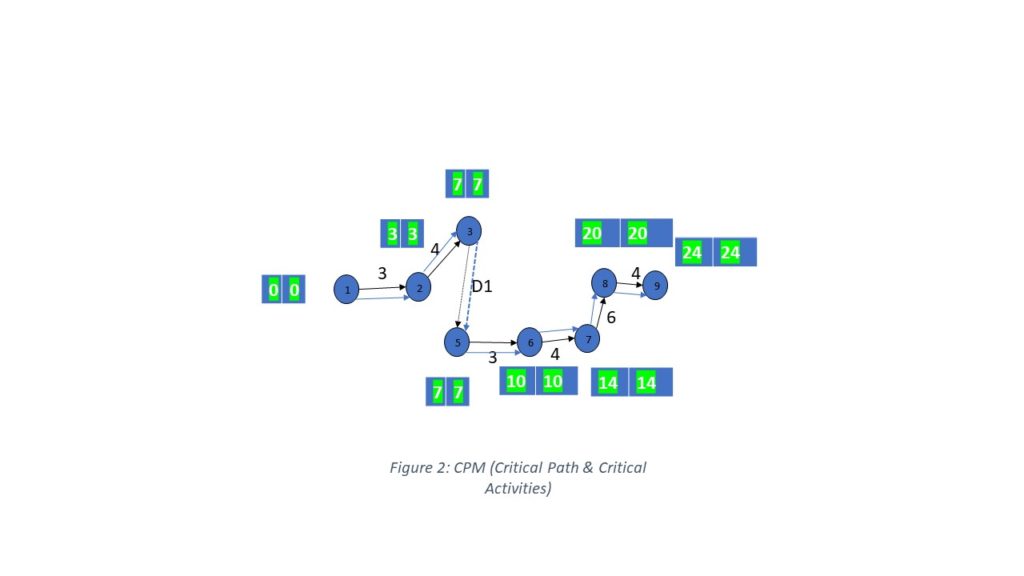
Critical Path : 1-2-3-5-6-7-8-9 (longest Duration Path)
Total Project Duration = 3+4+0+3+4+6+4 = 24
4.
TF & FF (As above table)
PERT
The program evaluation and review technique is a project planning and controlling process for projects having uncertainties and is considered useful for research & development types of projects. For example, developing and launching a missile, installation of machinery, r & d of products, marketing & advertising.
It is a logical sequence of activities but the time required for each activity is not certain.
Therefore, there associated three times and the expected duration of an activity is the weighted average of the three-time estimates. Three types of time estimates used in PERT are:
- Optimistic time
The shortest possible time for the completion of activities if everything goes well as expected. It is denoted by to.
- Pessimistic time
The longest possible time for completion of activity if everything goes wrong and is unexpected. It is denoted by tp.
- Most likely time
The other time most likely to occur and is between optimistic time and pessimistic time is known as most likely time and is denoted by tl.
Expected/average time (te) = (to+tp+4tl)/6
Gantt Chart (Henry Gantt,1900)
This is a graphical representation of various activities involved in a project. It has two coordinates. The horizontal ordinates or bar represents the duration of time taken. The vertical abscissa represents different types of activities.
The bar is divided into two parts longitudinally. The top portion indicates the progress of activities and the bottom portion indicates the duration.
Gantt charrt is also known as a bar chart.
Milestone chart
Milestone charts are the modification of a bar chart. The key events are identified and arranged in chronological order but not in a logical sequence.
Each event is numbered and a keynote is provided with it.
The key events are known as milestones.
