
1.1 Introduction to source and type of waste water:
- Quality of waste water or sewage must be known to design of sewer.
- Underestimate of waste water quantity may cause overflow on the street and unsanitary condition will be created.
- Overestimate of waste water quantity may cause uneconomical section and self-cleansing velocity may not be calculate.
- Waste water are classified as:
a. Sanitary sewage (Dry weather flow [DWF])
b. Strom sewage (Wet weather flow [WWF])
1.2 Sanitary sewage (DWF):
- Flow through sewer that is available during non-rainfall period.
- Minimum amount of flow throughout the year.
- Include waste water through residence and industries.
Source of sanitary sewage:
1. Public water supply:
- Include waste supplied from industries, commercial places and hospital.
- All supplied water are not converted into waste water.
2. Private waste supply:
- Water drawn from well, tube well and canal is part of private water supply.
- Water supplied to private institute, household etc.
3. Ground water sewage:
- Water from leaky joint is the source of sanitary sewage.
- When head of ground water is more than sewage head it occurs.
4. Unauthorized connection:
- Occurs due to unauthorized connection made by people in the sewer arrangement.
- Strom water is also considered in this section.
Factors affecting DWF:
- Population growth
- Rate of water supply
- Ground water infiltration
- Unauthorized connection
- Types of area served
Steps to determine DWF:
- Fix the design period.
- Forecast population for the design period.
- To obtain average sanitary sewage.
DWF = (70 to 90%) * (Population * Rate of water supply)
- To obtain peak sanitary sewage.
Qmax = Pf * DWF
Where,
Pf = Peak factor
1.3 Strom water or WWF:
- Include run off available from roof, yards, pavement and open space during rainfall.
Factors affecting WWF:
1. Catchment area:
- Catchment area is determined with help of map.
- Coefficient of surface runoff is calculated based upon the surface character.
2. Coefficient of runoff:
- Representation of fraction of total rainfall available in the form of storm water.
- Runoff coefficient increases with decrease in perviousness.
Rational method:
- Quantity of storm water from and area can be determined by rational method.
- This method gives reasonable estimate up to a maximum area of 400 ha.
Limitation and Assumption:
- It is limited to small catchment area.
- Precipitation is uniform over the entire catchment.
- Runoff is dominant by overland flow.
- Storm duration is equal to time of concentration.
- Basin storage is neglected.
1.4 Concept of time of concentration:
- Time of concentration is the time required for rain water to flow over ground surface from extreme point of catchment area to point under concentration.
Mathematically,
Time of concentration (tc)
tc = te + tf
where,
te = Time of entry
tf = Time of flow
Cases:
a. If time of runoff equals to time concentration.
- Maximum runoff occurs at point of concentration.
b. If time of concentration greater than time of runoff.
- Less runoff at point of concentration.
c. If time of runoff is greater than time of concentration.
- Rainfall intensity is less.
1.5 Concept of time area graph:
- Graph obtained by plotting duration storm in X – axis and area in Y – axis.
- To obtained proper result time-area graph is adopted.

Consider a drainage area with respective areas A1,A2, A3 and A4. At the commencement of the storm, rain water will be arriving at P only from the area A1 which is in the immediate vicinity of P. As the time passes, water from the respective areas A2, A3 and A4 will arrive and thus at the moment of the time of concentration water from the total area (A1 + A2 + A3 + A4) will be arriving at P.
Based on time of storm three cases are possible:
1. Duration of rainfall t>tc
When t=tc, peak discharge occurs till Tc and then it recedes.
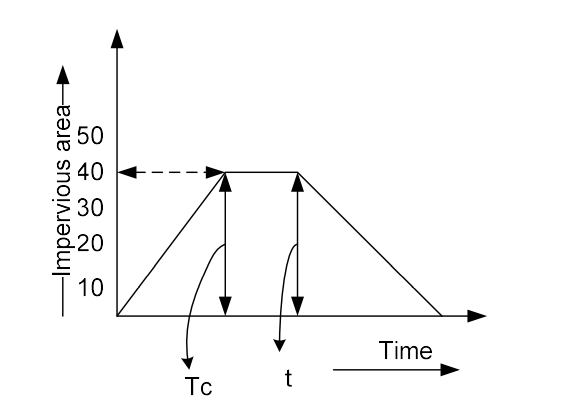
2. Duration of rainfall t<tc

3. Duration of rainfall t = tc

References:
- Modi, P.N. Environmental Engineering, Volume II : Waste Water Treatment, Disposal and Air Pollution Engineering. Delhi: Standard Book House.
- Garg. S.K. Environmental Engineering (Vol. II): Waste Water Engineering. Delhi: Khanna Publishers.