

Population (Universe)
Population means aggregate of all possible units under investigation. It need not be human
population. It may be population of plants, population of insects, population of fruits, etc.
Finite population
When the number of observation can be counted and is definite, it is known as finite population.
• No. of plants in a plot.
• No. of farmers in a village.
• All the fields under a specified crop.
Infinite population
When the number of units in a population is innumerably large, that we cannot count all of them, it is known as infinite population.
• The plant population in a region.
• The population of insects in a region.
Frame
A list of all units of a population is known as frame.
Parameter
A summary measure that describes any given characteristic of the population is known as parameter (in another word constant drawn from population is parameter). Population are described in terms of certain measures like mean, standard deviation etc. These measures of the population are called parameter and are usually denoted by Greek letters. For example, population mean is denoted by μ, standard deviation by σ and variance by σ2.
Sample
A portion or small number of unit of the total population is known as sample.
• All the farmers in a village(population) and a few farmers(sample)
• All plants in a plot is a population of plants.
• A small number of plants selected out of that population is a sample of plants.
Statistic
A summary measure that describes the characteristic of the sample is known as
Statistic (in other word constant drawn from sample observation is statistic). Thus sample mean , sample standard deviation (s) etc is statistic. The statistic is usually denoted by roman letter.
The statistic is a random variable because it varies from sample to sample.

Sampling
The method of selecting samples from a population is known as sampling.
Sampling technique
There are two ways in which the information is collected during statistical survey.
They are
1. Census survey
2. Sample survey
Census
It is also known as population survey and complete enumeration survey. Under census survey the information are collected from each and every unit of the population or universe.
Sample survey
A sample is a part of the population. Information are collected from only a few units of a population and not from all the units. Such a survey is known as sample survey. Sampling technique is universal in nature, consciously or unconsciously it is adopted in every day life.
For eg.
1. A handful of rice is examined before buying a sack.
2. We taste one or two fruits before buying a bunch of grapes.
3. To measure root length of plants only a portion of plants are selected from a plot.
Need for sampling
The sampling methods have been extensively used for a variety of purposes and
in great diversity of situations. In practice it may not be possible to collected information on all units of a population due to various reasons such as
1. Lack of resources in terms of money, personnel and equipment.
2. The experimentation may be destructive in nature. Eg- finding out the germination percentage of seed material or in evaluating the efficiency of an insecticide the experimentation is destructive.
3. The data may be wasteful if they are not collected within a time limit. The census survey will take longer time as compared to the sample survey. Hence for getting quick results sampling is preferred. Moreover, a sample survey will be less costly than complete enumeration.
4. Sampling remains the only way when population contains infinitely many number of units.
5. Greater accuracy.
Sampling methods
The various methods of sampling can be grouped under;
- Probability sampling or random sampling
Probability samplingis a technique in which every unit in the population has a chance
(non-zero probability) of being selected in the sample, and this chance can be accurately determined. Sample statistics thus produced, such as sample mean or standard deviation, are unbiased estimates of population parameters, as long as the sampled units are weighted according to their probability of selection. All probability sampling has two attributes in common: (1) every unit in the population has a known non-zero probability of being sampled, and (2) the sampling procedure involves random selection at some point.
- Non-probability sampling or non-random sampling
Nonprobability samplingis a sampling technique in which some units of the population have zero chance of selection or where the probability of selection cannot be accurately determined. Typically, units are selected based on certain non-random criteria, such as quota or convenience. Because selection is non-random, nonprobability sampling does not allow the estimation of sampling errors, and may be subjected to a sampling bias. Therefore, information from a sample cannot be generalized back to the population.
Probability sampling or Random sampling
Under this method, every unit of the population at any stage has equal chance (or)
each unit is drawn with known probability. It helps to estimate the mean, variance etc of
the population. Under probability sampling there are two procedures
1. Sampling with replacement (SWR)
2. Sampling without replacement (SWOR)
When the successive draws are made with placing back the units selected in the
preceding draws, it is known as sampling with replacement. When such replacement is
not made it is known as sampling without replacement. When the population is finite sampling with replacement is adopted otherwise SWOR is adopted.
There are many kinds of random sampling technique. Some of them are.
1. Simple Random Sampling
2. Systematic Random Sampling
3. Stratified Random Sampling
4. Cluster Sampling
Simple Random sampling (SRS)
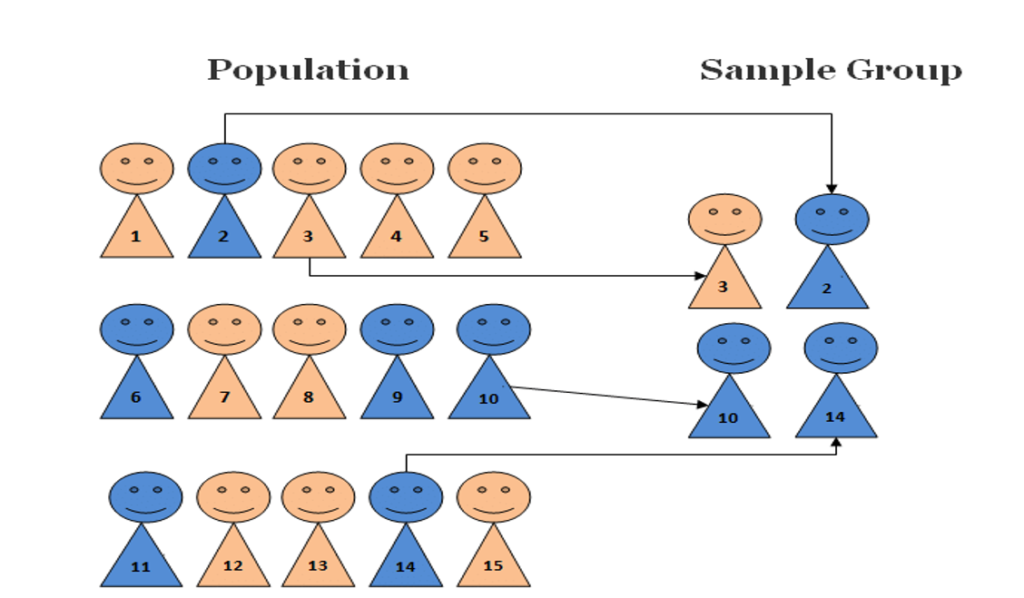
There are two methods in SRS
1. Lottery method
2. Random no. table method
Lottery method
This is most popular method and simplest method. In this method all the items of
the universe are numbered on separate slips of paper of same size, shape and color. They
are folded and mixed up in a drum or a box or a container. A blindfold selection is made.
Required number of slips is selected for the desired sample size. The selection of items
thus depends on chance.
For example, if we want to select 5 plants out of 50 plants in a plot, we number the 50 plants first. We write the numbers from 1-50 on slips of the same size, role them and mix them. Then we make a blindfold selection of 5 plants. This method is also called unrestricted random sampling because units are selected from the population without any restriction. This method is mostly used in lottery draws. If the population is infinite, this method is inapplicable. There is a lot of possibility of personal prejudice if the size and shape of the slips are not identical.
Random number table method
As the lottery method cannot be used when the population is infinite, the alternative method is using of table of random numbers. There are several standard tables of random numbers. But the credit for this technique goes to Prof. LHC. Tippet (1927). The random number table consists of 10,400 four-figured numbers. There are various other random numbers. They are fishers and
Yates (19380 comprising of 15,000 digits arranged in twos. Kendall and B.B Smith
(1939) consisting of 1, 00,000 numbers grouped in 25,000 sets of 4 digits random
numbers, Rand corporation (1955) consisting of 2, 00,000 random numbers of 5 digits
each etc.,
Merits
1. There is less chance for personal bias.
2. Sampling error can be measured.
3. This method is economical as it saves time, money and labor.
Demerits
1. It cannot be applied if the population is heterogeneous.
2. This requires a complete list of the population but such up-to-date lists are not available in many enquires.
3. If the size of the sample is small, then it will not be a representative of the
population.
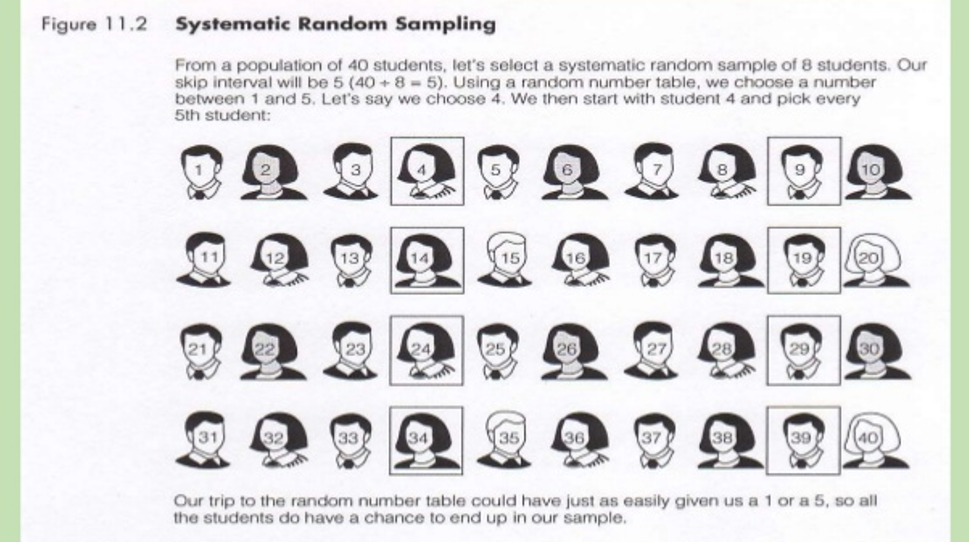
Stratified Sampling:

When the population is heterogeneous with respect to the characteristic in which
we are interested, we adopt stratified sampling. When the heterogeneous population is divided into homogenous sub-population, the sub-populations are called strata. From each stratum a separate sample is selected using simple random sampling. This sampling method is known as stratified sampling. We may stratify by size of farm, type of crop, soil type, etc.
The number of units to be selected may be uniform in all strata (or) may vary from stratum to stratum.
There are four types of allocation of strata
1. Equal allocation
2. Proportional allocation
3. Neyman’s allocation
4. Optimum allocation
If the number of units to be selected is uniform in all strata it is known as equal allocation of samples.
If the number of units to be selected from a stratum is proportional to the size of the stratum, it is known as proportional allocation of samples.
When the cost per unit varies from stratum to stratum, it is known as optimum allocation.
When the costs for different strata are equal, it is known as Neyman’s allocation.
Merits
1. It is more representative.
2. It ensures greater accuracy.
3. It is easy to administrate as the universe is sub-divided.
Demerits
1. To divide the population into homogeneous strata, it requires more money, time
and statistical experience which is a difficult one.
2. If proper stratification is not done, the sample will have an effect of bias.
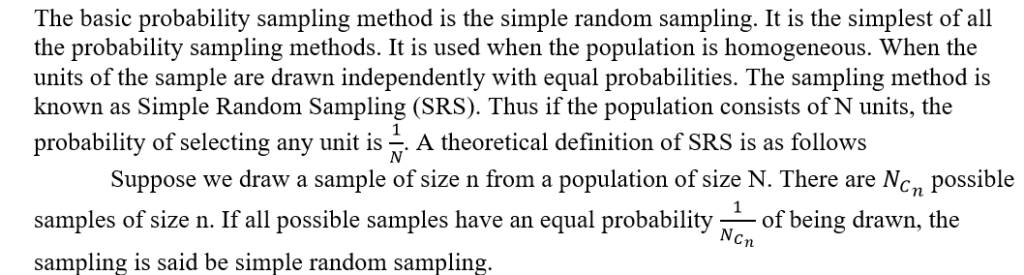
Systematic sampling:
The systematic sampling technique is operationally more convenient than simple random sampling. It also ensures, at the same time that each unit has an equal probability of inclusion in the sample. In this method of sampling, the first unit is selected with the help of random numbers, and the remaining units are selected automatically according to a predetermined pattern. This method is known as systematic sampling.
Suppose the N units in the population are numbered 1 to N in some order. Suppose further that N is expressible as a product of two integers n and k, so that N = nk.
To draw a sample of size n,
– select a random number between 1 and k.
– Suppose it is i.
– Select the first unit, whose serial number is i.
– Select every kth unit after ith unit.
– The sample will contain i, i+k, i+2k, i+3k, ……… i+(n-1) k.
For example: A researcher wants to select a systematic random sample of 10 people from a population of 100. If she or he has a list of all 100 people, he would assign each person a number from 1 to 100. The researcher then picks a random number from 1 to 10. let us say selected number is 6, which is taken as starting number (or random start). He or she would then select every tenth person for the sample (because the sampling interval(k) = 100/10=10). The final sample would contain those individuals who were assigned the following numbers: 6,16,26,36,46,56,66,76,86,96.
Merits
(a) This is a simple method of selecting a sample.
(b) It reduces the field cost.
(c) Inferential statistics may be used.
(d) Sample may be comprehensive and representative of population.
(e) Observations of the sample may be used for drawing conclusions and generalizations.
Demerits
(a) This is not free from error, since there is subjectivity due to different ways of systematic list by different individuals. Knowledge of population is essential.
(b) Information of each individual is essential.
(c) This method can’t ensure the representativeness.
(d) There is a risk in drawing conclusions from the observations of the sample.
Cluster sampling:
Cluster sampling is a sampling technique where the entire population is divided into groups, or clusters and a random sample of these clusters are selected. All observations in the selected clusters are clusters are included in the sample. Here, in order to increase the precision of the estimates, the population should be partitioned into clusters in such a way that variation within clusters should be as large as possible, while the variation between clusters should be as small as possible.
Cluster sampling is typically used when the researcher cannot get a complete list of the members of the population they wish to study but can get a complete list of groups or clusters of the population. It is also used when a random sample would produce a list of subjects so widely scattered that surveying them would prove to be far too expensive.
For example: the list of all the agricultural farms in a village or district may not be easily available but the list of villages and the districts are available. In each case farm is sampling unit and every village or the district is the cluster.
Merits
(a) It may be a good representative of the population.
(b) It is an easy method.
(c) It is an economical method.
(d) It is practicable and highly applicable in education.
(e) Observations can be used for inferential purpose.
Demerits
(a) Cluster sampling is not free from error.
(b) It is not comprehensive.
Sampling distribution of mean:
Mean
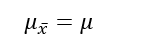
The mean of the sampling distribution of the mean is the mean of the population from which the scores were sampled. Therefore, if a population has a mean μ, then the mean of the sampling distribution of the mean is also μ. The symbol is used to refer to the mean of the sampling distribution of the mean. Therefore, the formula for the mean of the sampling distribution of the mean can be written as:
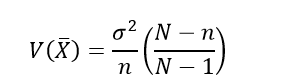
Variance
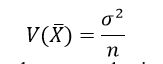
The variance of the sampling distribution of the mean is computed as follows:
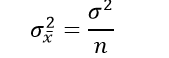
That is, the variance of the sampling distribution of the mean is the population variance divided by ‘n’, the sample size. Thus, the larger the sample size, the smaller the variance of the sampling distribution of the mean.
The standard error of the mean is the standard deviation of the sampling distribution of the mean. It is therefore the square root of the variance of the sampling distribution of the mean and can be written as:

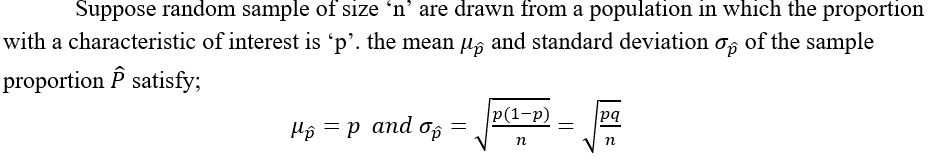
Sampling distribution of Proportion:
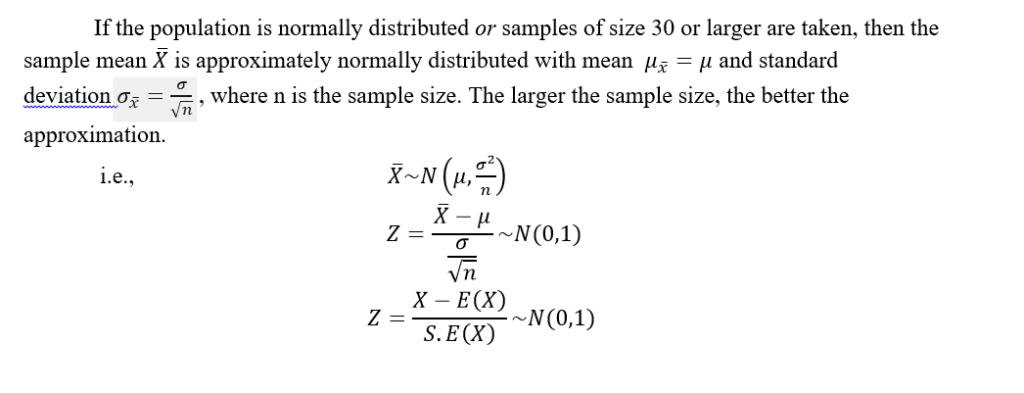
The Central limit theorem(CLT):
Example:
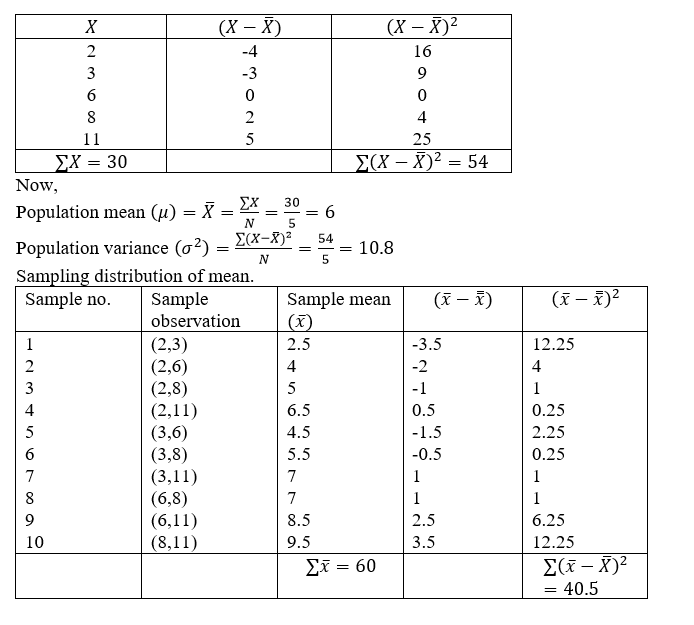
A population consists of five members 2,3,6,8 and 11.
- Draw all possible samples of size 2 that can be drawn from this population without replacement.
- Find mean and variance of the population.
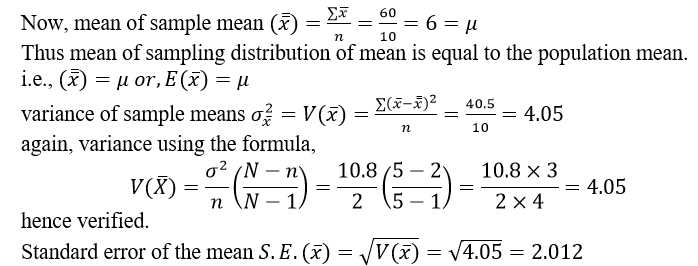
- Find the mean of sampling distribution of means and show that it is equal to the population mean.
- Find the variance of sampling distribution of means and also verify with the formula
- Find the standard error of the mean.
Solution:
Here, N = 5, n = 2
Possible number of samples of size 2 which can be drawn from the population of size 5 without replacement is,
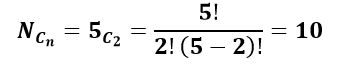
Possible sample are:
{(2,3), (2,6), (2,8), (2,11), (3,6), (3,8), (3,11), (6,8), (6,11), (8,11)}
Calculation of population mean and variance.
Example:
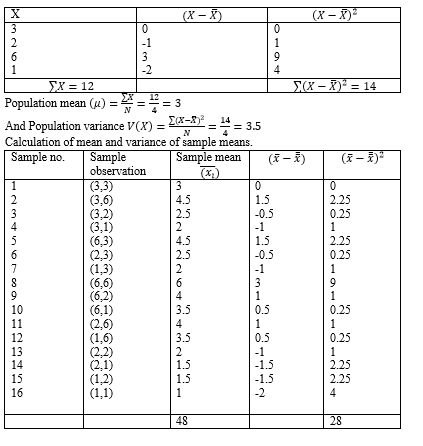
Consider a population of 4 units with values 3,6,2,1.
- Write down all possible samples of size of 2 that can be drawn with replacement for this population.
- Find mean and variance of the population.
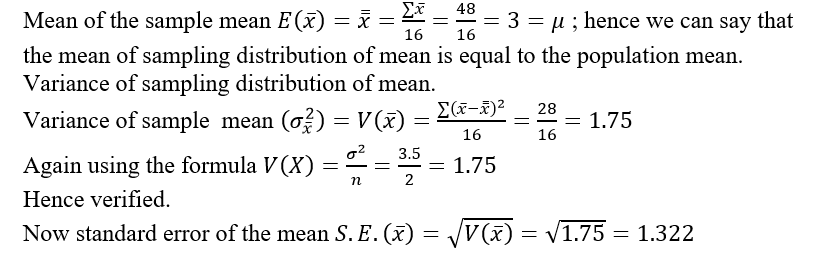
- Find mean of the sampling distribution of means and show that it is equal to the population mean.
- Find the variance of the sampling distribution of means , also verify that it agrees with the formula,
where = population variance and n = sample size.
- Find the standard error of the mean.
Solution:
Here population consists of 4 values 3,6,2,1. Thus sample size of 2 can be drawn with replacement from the population of size 4 in N2 = 42 =16 ways.
Thus possible samples are: {(3,3), (3,6), (3,2), (3,1), (6,3), (2,3), (1,3), (6,6), (6,2), (6,1), (2,6), (1,6), (2,2), (2,1), (1,2), (1,1)}
Mean and variance of the population.
Estimation:
It is a process of obtaining the characteristics of a population from the information contained in the sample. Samples are used instead of the whole population for various reasons; financial or time constraints, checking the items involves a destructive process or the whole population is not accessible. The population characteristic (Parameter) is thus estimated from the sample characteristic (Statistic). An estimate is a value calculated from sample observations while an estimator is the Statistic whose value can be used to guess the value of the population parameter.
Characteristics of good estimator:
A good estimator must be
- Unbiased
- Efficient
- Consistent and
- Sufficient.
- Unbiasedness: An estimator (tn) is said to be unbiased if its expected value is equal to the parameter. i.e. E(tn) =θ, where tn is an estimate.
- Consistency: An estimator is consistent if, as the sample size (n) increases, the estimate approaches the true population value. This implies that as the sample size increases, the variance of the estimator tends to zero.
- Efficiency: This implies having the minimum variance among the group of unbiased estimators. i.e., An estimator tn and tn’ are two consistent estimators the, tn is more efficient than tn’ if V(tn)< V(tn’).
- Sufficiency: An estimator is said to be sufficiency for a parameter, if it contains all the information in the sample regarding the parameter.
Example:1
A population consists of value 1,2,3,6,8. Prove that the sample mean of sample size 3 is unbiased estimator of population mean. (without replacement)
Solution:
Here population consists of 5 values 1,2,3,6 and 8. So population mean of five observation is,
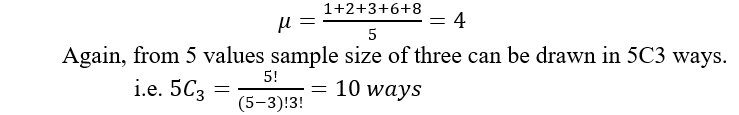
These 10 ways are tabulated in figure as,

So we can say that sample mean of size 3 is unbiased estimator of population mean.
Types of estimation:
There are two types of estimation
- Point estimation: If a single value is estimated from the sample observation as an unbiased estimate of population parameter then, the method is point estimation.
- Interval estimation: The interval (C1, C2) within which the unknown value of population parameter is expected to lie with confidence probability (1-α) is confidence interval and the method of finding (C1, C2) using confidence probability (1-α) is interval estimation.
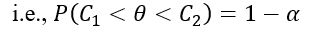
where,
C1 = Lower confidence limit (LCL).
C2 = Upper confidence limit (UCL).
θ= Parameter and
(1-α) = Confidence probability.
The confidence level describes the uncertainty associated with a sampling method. Suppose we used the same sampling method to select different samples and to compute a different interval estimate for each sample. Some interval estimates would include the true population parameter and some would not. A 90% confidence level means that we would expect 90% of the interval estimates to include the population parameter; a 95% confidence level means that 95% of the intervals would include the parameter; and so on.
Confidence interval for Population mean (µ ) for large sample (
a. When the sample size is large (i.e. n ≥ 30), the (1-α) x100% confidence interval for µ is,
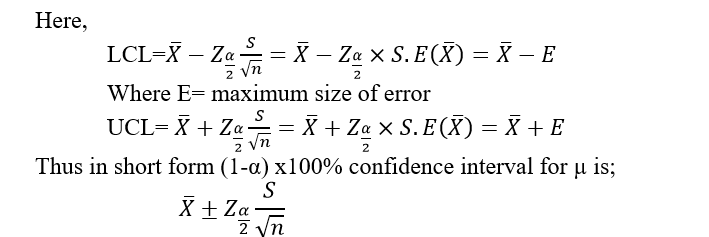
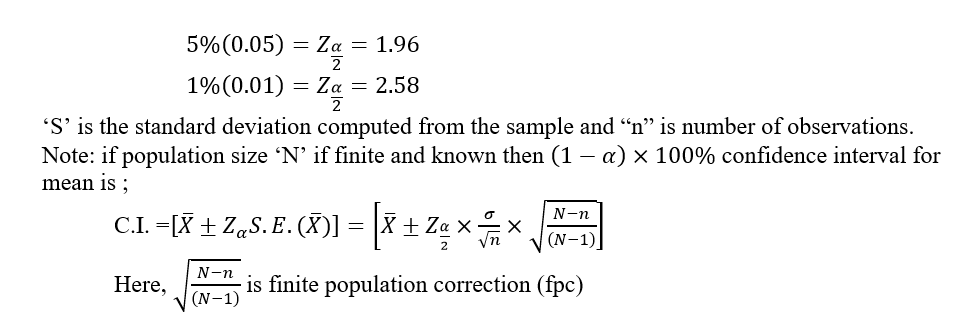
Where α is the level of significance, mostly taken as 5% (0.05) or 1% (0.01), is the standardized value of the given level of confidence {(1-α) x100%} obtained from tables of Normal distribution. The values for 5% and 1% level are:
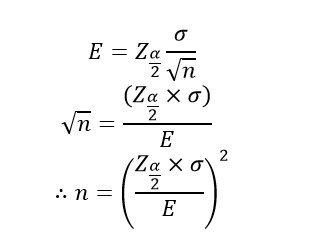
Determination of sample size:
If population standard deviation (σ )and maximum size of error (E) are known then we can estimate the sample size for the survey as;
When the sample size is small (n< 30 and σ is unknown), the (1-α) x100% confidence interval for µ is assumed to have t-distribution with (n-1) degree of freedom.

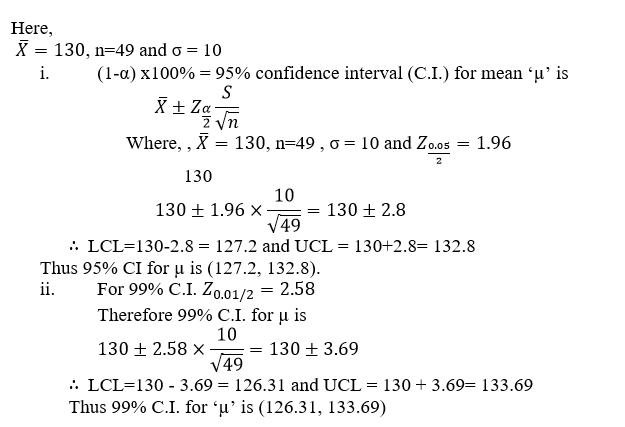
Example:
In an experiment to estimate the heart beat rate per minute for a certain male population, a random sample of 49 men were selected and the average heart beat was found to be 130 per minute. if the population variance is 100 pulse rate per minute, find (i)95% (ii) 99% confidence interval for the population mean (µ).
Solution:
Since n is large (i.e. n>30), we assume normal distribution.
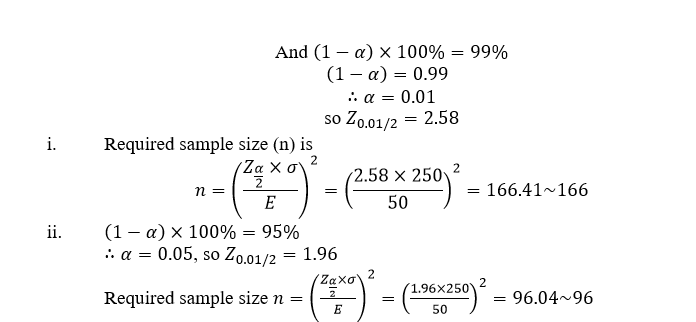
Example:
A consumer group wishes to estimate the average electric bills for the month of July for single –family homes in a large city. Based on studies conducted in other cities the standard deviation is assumed to be Rs. 250. The group wants to estimate the average bill for July to within Rs. 50 of the true average with 99% confidence.
- What sample size is needed?
- If 95% confidence is desired, what sample size (n) is needed?
Solution:
Here, standard deviation =Rs. 250, maximum size of error (E) =50
Example:4
From a population of 540, a sample of 60 individuals is taken. From this sample, the mean is found to be 6.2 and standard deviation 1.368.
- Find the standard error of the mean.
- Construct 96% confidence for the mean.
Solution:

Example:
The weights of 10 pieces of potatoes from a farm are 9.8, 9.9, 10.3, 10.1, 10.4, 10.3, 10.2, 9.7, 10.1 and 9.8 grams. Find the (i) 95% and (ii) 99% confidence interval for the Population mean of all potatoes in the farm.
Solution:
Since ‘n’ is small and population standard deviation (σ) is unknown (i.e. n< 30 and σ unknown), we assume the student t distribution.
Now, calculation of sample mean and sample s.d.
| x | x2 |
| 9.8 | 96.04 |
| 9.9 | 98.01 |
| 10.3 | 106.09 |
| 10.1 | 102.01 |
| 10.4 | 108.16 |
| 10.3 | 106.09 |
| 10.2 | 104.04 |
| 9.7 | 94.09 |
| 10.1 | 102.01 |
| 9.8 | 96.04 |
| 100.6 | 1012.58 |

Confidence interval for population proportion (P)

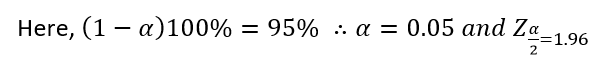
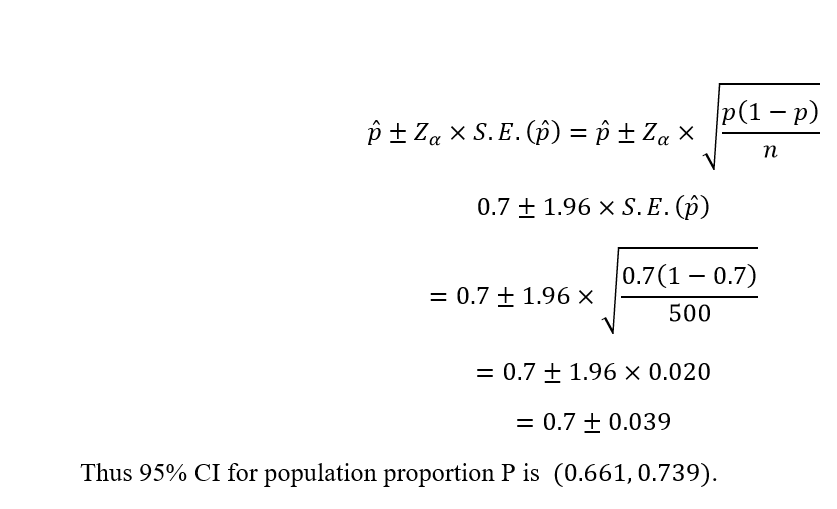
Example:
A survey of 500 people shopping at a shopping mall, selected at random, showed that 350 of them used cash and 150 of them used credit cards. Construct a 95% confidence interval estimate of the proportion of all the persons at the mall, who use cash for shopping.
Solution:
Here, sample size (n)= 500, out of which 350 used cash for shopping.
So sample proportion of cash users (p) = and q = (1-p) =1-0.7 = 0.3
Then 95% CI for population proportion P is
Reference : Probability and statistics for engineers by Toya Naryan Paudel & Pradeep Kunwar, Sukunda Pustak Bhawan.